Education wing · by Coldie
How has the US national debt grown since 1790?
The US national debt was $71 million in 1790, mostly the bill for the Revolutionary War. By the Treasury's own records it passed $1 trillion in 1981, $10 trillion in 2008 and $40 trillion on August 18, 2026. It has almost never shrunk for long. The one time the country came close to owing nothing was January 1, 1835, when the debt was $33,733, and the total has not fallen from one year-end to the next since 1957. More than 99% of today's debt was borrowed after August 15, 1971, the day the dollar's last link to gold was cut. Lately it adds a trillion dollars every few months.
This is every figure the Treasury has on record: one per year from 1790, and one for every business day since April 1993. Drag it, zoom it, or walk through the moments that bent the line.
236 years of borrowing, one line
Drag the chart, or the strip under it, to move through time. Pinch, or use + and −, to zoom. The closer you get, the finer the record: one figure a year before 1993, one for every business day after. Switch to Log to see the early centuries, which are otherwise a flat line next to today.
Source: U.S. Treasury Fiscal Data (Historical Debt Outstanding; Debt to the Penny), loaded live and rounded to the whole dollar. Per-person figures divide by Census population, interpolated between censuses and projected after 2024. "$1 buys in gold" uses the World Bank's monthly average gold price (Pink Sheet, CC BY 4.0). "Estimate right now" extends the latest official total at the past year's average pace. It is my arithmetic, not a Treasury number.
Gold-backed vs. fiat: the line breaks in 1971
Gold-backed dollar · 1790 to 1971
$398,129,744,456
Total debt after 181 years, at the last reading before the gold window closed (Jun 30, 1971).
Fiat dollar · 1971 to today
+$39,670,678,247,469
Added in 55 years. That is 99.0% of all the debt the country owes today.
For its first 181 years the dollar was, one way or another, a claim on gold. On August 15, 1971, President Nixon closed the gold window, and from that day the dollar has been backed by nothing but the government's word. Look at where the gold line turns rust on the chart: the debt was about $398 billion then. It is roughly 101 times that now. This is the hinge the whole Filthy Fiat project turns on. A dollar is a promise, and after 1971 the promise is all there is.
The honest footnote: gold backing was never perfectly clean. The Civil War greenbacks could not be traded for gold until 1879, and from 1933 ordinary Americans could not trade dollars for gold at all; only foreign governments could, at $35 an ounce. 1971 closed that last door. What fiat currency means.
What a dollar buys in gold
The other half of the story is how much pure gold one dollar is worth. Congress first defined the dollar in gold in 1792, at 1.604 grams. From 1837 until 1933 a dollar was 1.505 grams, by law, for nearly a century. In 1934 the price of gold was raised to $35 an ounce and a dollar shrank to 0.889 grams. After 1971 no law holds it anywhere. In August 2026 gold averaged $4,411 an ounce, so a dollar bought 0.0071 grams: 0.79% of what it bought in 1934, and 0.47% of what it bought for most of the 1800s.
Put that next to the chart above and 1971 looks like a pair of scissors. The debt, counted in dollars, opens upward. The dollar, counted in gold, closes toward zero. My buried bills lost their bodies to mold. Every other dollar lost its gold to arithmetic.
| When | Gold, per ounce | $1 buys | Price |
|---|---|---|---|
| Apr 2, 1792 | $19.39 | 1.6038 g | set by law |
| Aug 1, 1834 | $20.69 | 1.5033 g | set by law |
| Jan 18, 1837 | $20.67 | 1.5046 g | set by law |
| Jan 31, 1934 | $35.00 | 0.8887 g | set by law |
| January 1960 | $35.00 | 0.8887 g | market, monthly average |
| August 1971 | $43.00 | 0.7233 g | market, monthly average |
| January 1980 | $675.00 | 0.0461 g | market, monthly average |
| January 2001 | $265.00 | 0.1174 g | market, monthly average |
| September 2011 | $1,772.00 | 0.0176 g | market, monthly average |
| August 2026 | $4,411.00 | 0.0071 g | market, monthly average |
Grams of pure gold, at 31.1035 grams per troy ounce. The official price ignores the Civil War greenback years (1862 to 1878), when paper dollars traded below their gold value.
What the line is made of
Two Treasury records stitched end to end. Before April 1993 the government's own history gives one figure a year, taken at the close of each fiscal year. From 1993 on, the Bureau of the Fiscal Service publishes the total every business day and calls it the Debt to the Penny. This project is built out of one-dollar bills, so here it is to the dollar: the pennies are the only part of the debt small enough to ignore. Zoom in on the daily side and the line turns jittery, because debt is not a smooth curve. It is a stack of individual bond auctions and redemptions.
The dashed line is the part owed to the outside world: investors, banks, foreign governments and the Federal Reserve. The gap between it and the total is money the government owes itself, mostly to the Social Security and other trust funds. That gap explains the one odd moment in the modern record: from 1998 to 2001 the country ran budget surpluses and the public part shrank, but the total kept climbing.
The US national debt by year
Treasury's own year-end figures, rounded to the dollar, every ten years from 1790 and every year since 2015. The date is when Treasury took the reading: January 1 in the early years, then the close of each fiscal year (around July 1 until 1976, September 30 after).
| Year | Recorded | Total debt | Per person |
|---|---|---|---|
| 1790 | Jan 1, 1790 | $71,060,508 | $18 |
| 1800 | Jan 1, 1800 | $82,976,294 | $16 |
| 1810 | Jan 1, 1810 | $53,173,218 | $7 |
| 1820 | Jan 1, 1820 | $91,015,566 | $9 |
| 1830 | Jan 1, 1830 | $48,565,406 | $4 |
| 1840 | Jan 1, 1840 | $3,573,344 | less than $1 |
| 1850 | Jul 1, 1850 | $63,452,774 | $3 |
| 1860 | Jul 1, 1860 | $64,842,288 | $2 |
| 1870 | Jul 1, 1870 | $2,480,672,428 | $64 |
| 1880 | Jul 1, 1880 | $2,120,415,371 | $42 |
| 1890 | Jul 1, 1890 | $1,552,140,205 | $24 |
| 1900 | Jul 1, 1900 | $2,136,961,092 | $28 |
| 1910 | Jul 1, 1910 | $2,652,665,838 | $29 |
| 1920 | Jul 1, 1920 | $25,952,456,406 | $243 |
| 1930 | Jun 30, 1930 | $16,185,309,831 | $131 |
| 1940 | Jun 29, 1940 | $42,967,531,038 | $323 |
| 1950 | Jun 30, 1950 | $257,357,352,351 | $1,687 |
| 1960 | Jun 30, 1960 | $286,330,760,848 | $1,587 |
| 1970 | Jun 30, 1970 | $370,918,706,950 | $1,816 |
| 1971 | Jun 30, 1971 | $398,129,744,456 | $1,928 |
| August 15, 1971: the dollar's last link to gold is cut. Every row below is the fiat era. | |||
| 1980 | Sep 30, 1980 | $907,701,000,000 | $3,979 |
| 1990 | Sep 28, 1990 | $3,233,313,451,777 | $12,882 |
| 2000 | Sep 30, 2000 | $5,674,178,209,887 | $20,023 |
| 2010 | Sep 30, 2010 | $13,561,623,030,892 | $43,693 |
| 2015 | Sep 30, 2015 | $18,150,617,666,484 | $56,440 |
| 2016 | Sep 30, 2016 | $19,573,444,713,937 | $60,433 |
| 2017 | Sep 30, 2017 | $20,244,900,016,054 | $62,065 |
| 2018 | Sep 30, 2018 | $21,516,058,183,180 | $65,496 |
| 2019 | Sep 30, 2019 | $22,719,401,753,434 | $68,670 |
| 2020 | Sep 30, 2020 | $26,945,391,194,615 | $80,948 |
| 2021 | Sep 30, 2021 | $28,428,918,570,049 | $84,918 |
| 2022 | Sep 30, 2022 | $30,928,911,613,307 | $91,857 |
| 2023 | Sep 30, 2023 | $33,167,334,044,723 | $97,942 |
| 2024 | Sep 30, 2024 | $35,464,673,929,172 | $104,126 |
| 2025 | Sep 30, 2025 | $37,637,553,494,936 | $109,876 |
| 2026 (latest) | Sep 24, 2026 | $40,068,807,991,925 | $116,316 |
When the debt hit each trillion
The first four trillions predate the daily record, so they are dated by fiscal year. From $5 trillion on, the date is the first business day Treasury's daily total closed at or above the mark.
Every trillion, from $1 trillion to $40 trillion
| Milestone | First reached | Time since the previous trillion |
|---|---|---|
| $1 trillion | fiscal year 1982 | |
| $2 trillion | fiscal year 1986 | |
| $3 trillion | fiscal year 1990 | |
| $4 trillion | fiscal year 1992 | |
| $5 trillion | Feb 23, 1996 | |
| $6 trillion | Feb 26, 2002 | 6.0 years |
| $7 trillion | Jan 15, 2004 | 1.9 years |
| $8 trillion | Oct 18, 2005 | 1.8 years |
| $9 trillion | Aug 31, 2007 | 1.9 years |
| $10 trillion | Sep 30, 2008 | 1.1 years |
| $11 trillion | Mar 16, 2009 | 5 months |
| $12 trillion | Nov 16, 2009 | 8 months |
| $13 trillion | Jun 1, 2010 | 6 months |
| $14 trillion | Dec 31, 2010 | 7 months |
| $15 trillion | Nov 15, 2011 | 10 months |
| $16 trillion | Aug 31, 2012 | 10 months |
| $17 trillion | Oct 17, 2013 | 1.1 years |
| $18 trillion | Nov 28, 2014 | 1.1 years |
| $19 trillion | Jan 29, 2016 | 1.2 years |
| $20 trillion | Sep 8, 2017 | 1.6 years |
| $21 trillion | Mar 15, 2018 | 6 months |
| $22 trillion | Feb 11, 2019 | 11 months |
| $23 trillion | Oct 31, 2019 | 9 months |
| $24 trillion | Apr 7, 2020 | 5 months |
| $25 trillion | May 5, 2020 | 1 months |
| $26 trillion | Jun 9, 2020 | 1 months |
| $27 trillion | Oct 1, 2020 | 4 months |
| $28 trillion | Mar 1, 2021 | 5 months |
| $29 trillion | Dec 16, 2021 | 10 months |
| $30 trillion | Jan 31, 2022 | 2 months |
| $31 trillion | Oct 3, 2022 | 8 months |
| $32 trillion | Jun 15, 2023 | 8 months |
| $33 trillion | Sep 15, 2023 | 3 months |
| $34 trillion | Dec 29, 2023 | 3 months |
| $35 trillion | Jul 26, 2024 | 7 months |
| $36 trillion | Nov 21, 2024 | 4 months |
| $37 trillion | Aug 11, 2025 | 9 months |
| $38 trillion | Oct 21, 2025 | 2 months |
| $39 trillion | Mar 17, 2026 | 5 months |
| $40 trillion | Aug 18, 2026 | 5 months |
Why the line goes flat, then falls off a cliff
Zoom into early 2023 or the first half of 2025 and the line goes dead flat for months. That is the debt ceiling, a legal limit Congress sets on borrowing. When the total hits it, Treasury shuffles accounts to keep paying bills and stops adding debt. When Congress raises the limit, all the postponed borrowing arrives at once: $359 billion in a single day in June 2023, and $366 billion on July 7, 2025, the biggest one-day jump in the daily record.
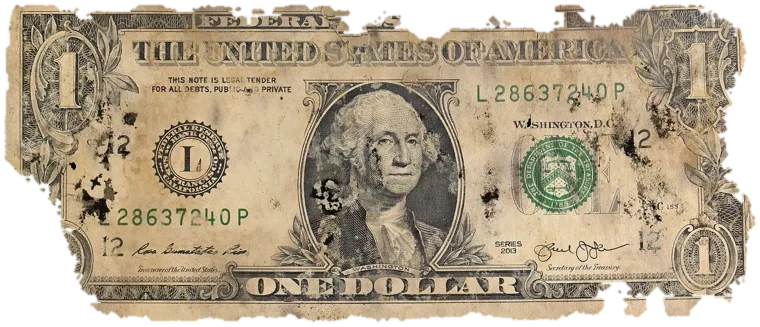
What this has to do with a moldy dollar
Technically, the dollar in your wallet is not part of this number. A Federal Reserve Note is a liability of the Federal Reserve, not a Treasury bond. But the two are cousins: the Fed holds a large pile of Treasury debt on its books, and ever since 1971, when the dollar let go of gold, the only thing standing behind either one is the government's promise to keep its promises.
The bills in this collection are Series 2003A to 2013. Over those series years the debt went from $6.8 trillion to $16.7 trillion (look for the green band on the chart). Then the bills went underground for two years and came back half eaten. The debt, which never goes anywhere near dirt, came back bigger. If you want the slow leak in the other direction, the one your savings feel, read how much buying power the dollar has lost.
Related questions
How much is the US national debt right now?
As of Sep 24, 2026, total public debt outstanding was $40,068,807,991,925, rounded to the dollar, according to the U.S. Treasury's daily Debt to the Penny report. Over the previous year it grew by $2.61 trillion, about $7.2 billion a day. The chart on this page loads the newest Treasury figure each time it opens.
How much is the national debt per person?
About $116,300 for every person in the United States: the Sep 24, 2026 total divided by an estimated population of 344.5 million, projected from Census Bureau counts.
How much has the debt grown since the US left the gold standard?
On June 30, 1971, weeks before President Nixon ended the dollar's convertibility to gold, the debt was $398,129,744,456. As of Sep 24, 2026 it was $40,068,807,991,925, roughly 101 times larger. 99.0% of today's debt was added in the fiat era.
How much gold does one dollar buy?
In August 2026, with gold averaging $4,411 an ounce (World Bank monthly average), one dollar bought 0.0071 grams of gold. By law a dollar was 1.505 grams from 1837 to 1933 and 0.889 grams from 1934 until the gold window closed in 1971. Today's dollar buys 0.79% of the gold it did in 1934.
Who does the United States owe the debt to?
Mostly to whoever holds Treasury securities: investors, banks, pension funds, foreign governments and the Federal Reserve. Treasury calls that debt held by the public, about $32.4 trillion in September 2026. The other $7.7 trillion or so the government owes to itself, mainly to trust funds like Social Security's.
What is the debt ceiling?
A legal limit Congress sets on how much the Treasury may borrow. When the debt reaches it, Treasury uses accounting workarounds to keep paying bills, and the daily total goes flat. When Congress raises or suspends the limit, the delayed borrowing lands at once, which is why the chart shows long flat stretches followed by cliffs.
Has the US ever paid off the national debt?
Almost, once. On January 1, 1835, under President Andrew Jackson, the debt was $33,733. Public land sales had filled the Treasury. The Panic of 1837 started the borrowing again.
Is the debt the same thing as the deficit?
No. The deficit is how much more the government spends than it collects in one year. The debt is the running total of all those years of borrowing, minus what has been paid back.
How current is this chart?
Treasury publishes the total every business day, for the day before. The chart loads any newer days straight from Treasury when you open the page, so the last point is usually yesterday or the business day before.
Keep reading
The doorway
Everything on this page is illustrated with real dollars that spent two years underground.
See what nature made of themSOURCES · U.S. Treasury Fiscal Data: Debt to the Penny (daily, 1993 to today) · U.S. Treasury Fiscal Data: Historical Debt Outstanding (yearly, 1790 to today) · U.S. Census Bureau: decennial census counts and population estimates · World Bank Commodity Price Data (The Pink Sheet): monthly gold price, 1960 to today · UPDATED 2026-09-27